SUI price prediction – Why the token can lose another 7%

![]()
Journalist
Posted:
- SUI’s price action on the daily chart showed the $3 support was a must-defend zone.
- The steady losses in recent weeks and a lack of bullish conviction could see prices fall to $2.43.
Sui [SUI] was retesting the psychological $3 support level once again. It had previously tested this level as support a week ago, before bouncing nearly 20% to reach the $3.6 supply zone.
Such a bounce might not repeat itself immediately, given the state of the rest of the market.
Liquidity beckons SUI lower
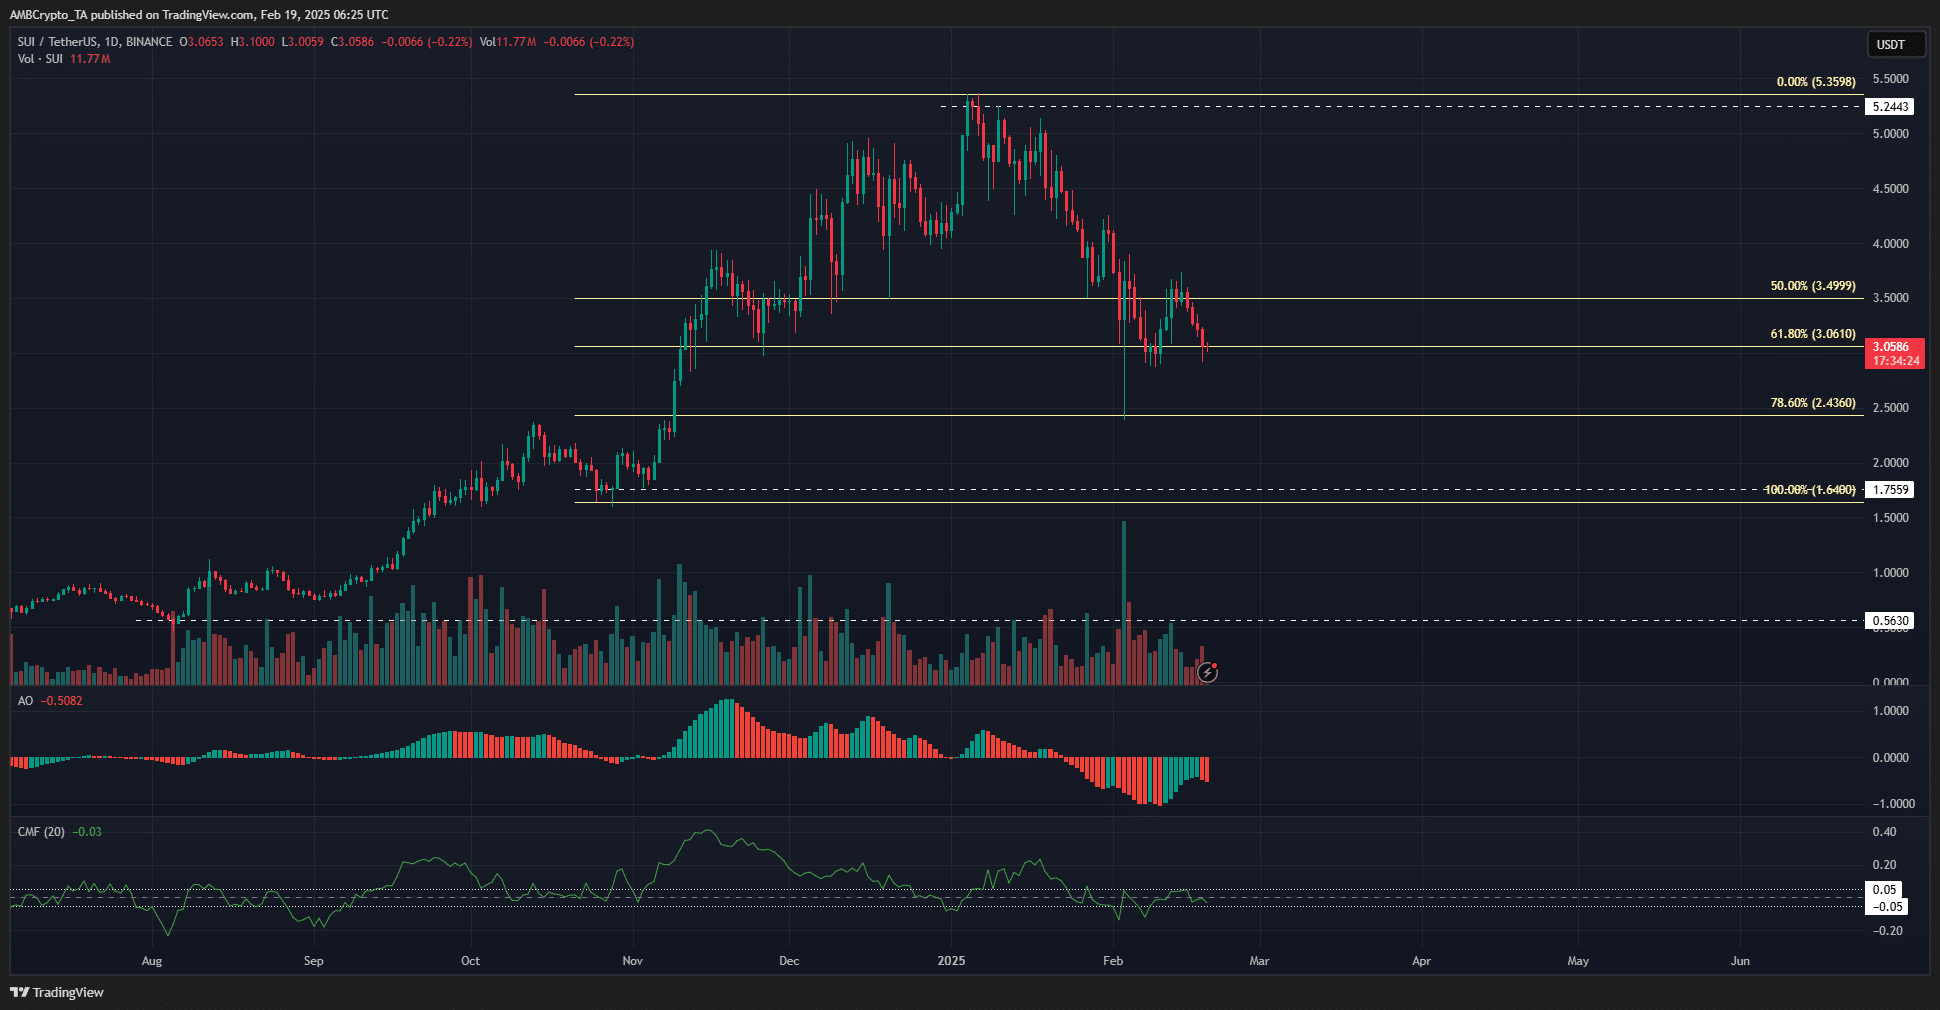
Source: SUI/USDT on TradingView
The price action on the higher timeframes was not too bearish. The weekly chart showed that the swing points were at $1.75 and $5.24, with price in a retracement phase.
The daily and lower timeframes showed rising bearishness over the past month.
The Awesome Oscillator was forming red bars on the histogram to show increased downward momentum. However, the CMF did not yet fall below -0.05, which would signal substantial capital outflows.
The conclusion was that selling pressure and bearish momentum were prevalent, but there is some hope that the downtrend would be halted at $3 or $2.43.
These two levels were the key levels for bulls to watch due to their importance as Fibonacci retracements.
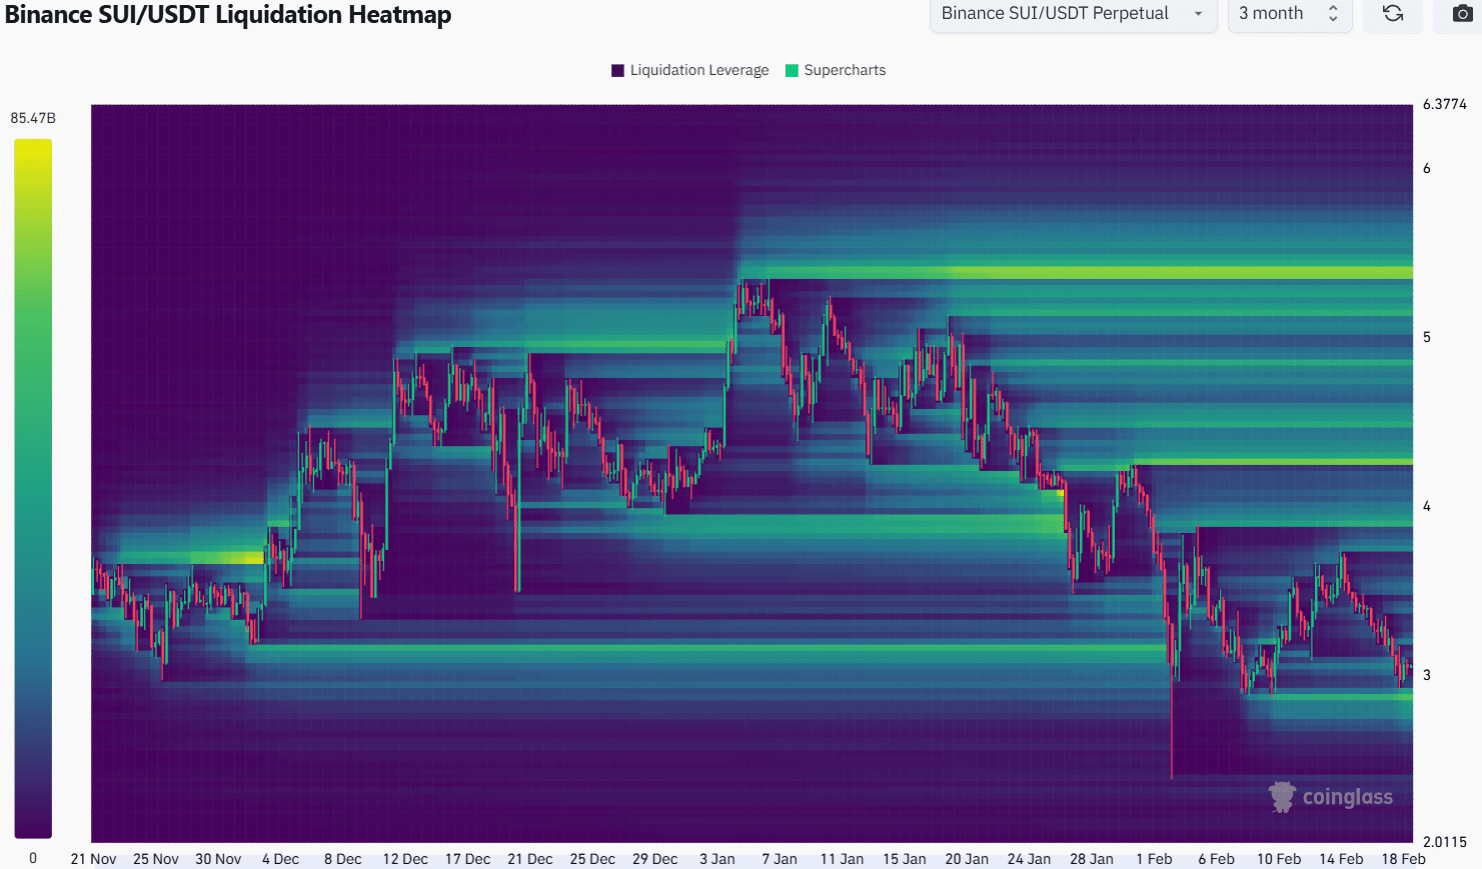
Source: Coinglass
The 3-month liquidation heatmap threw light on the $2.84 and $3.9 levels as sizeable liquidity pockets around price. There were magnetic zones at $3.2 and $3.53, but these were less densely populated.
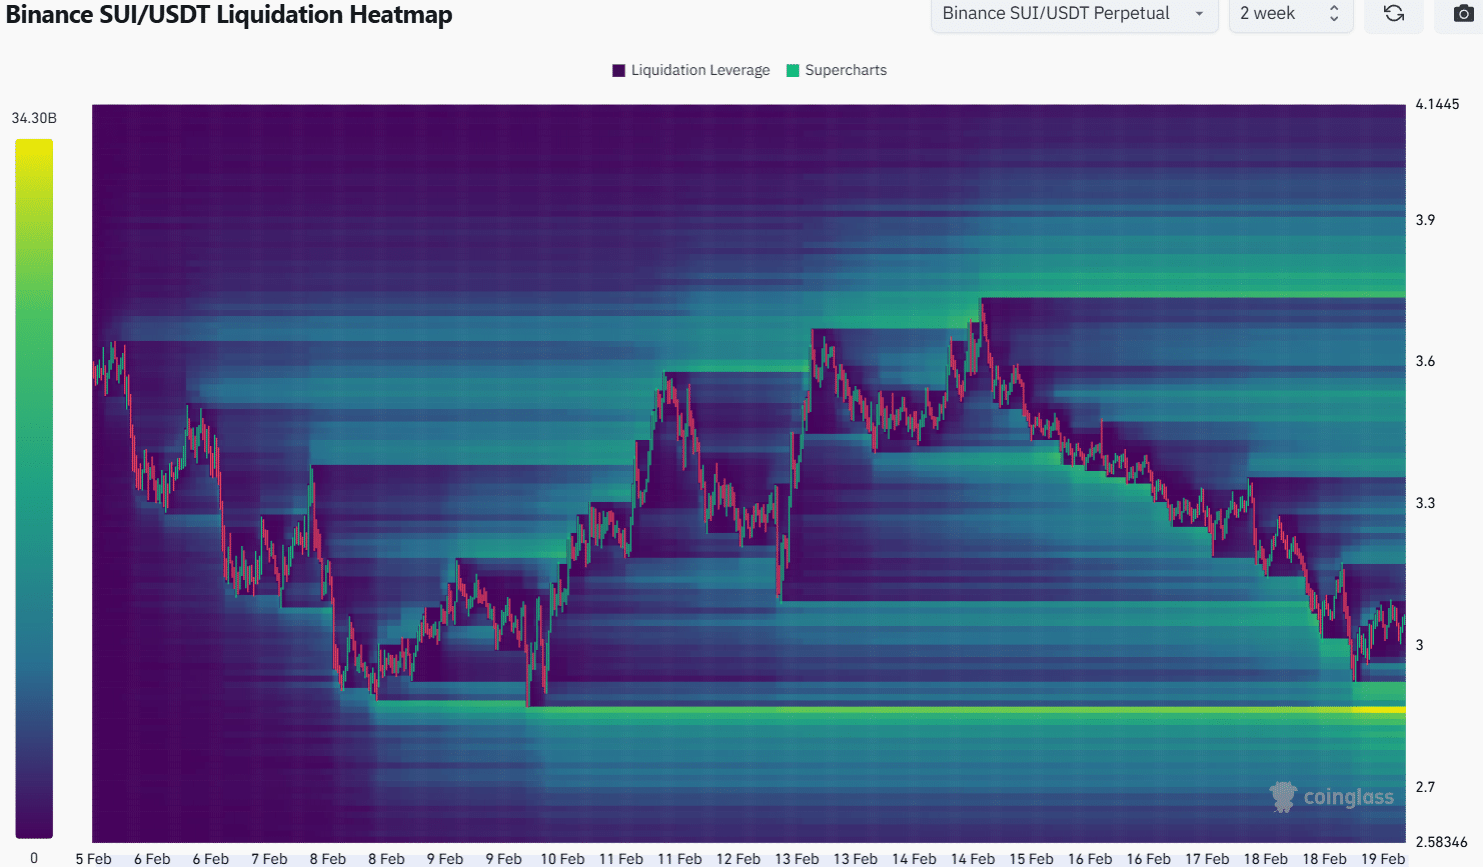
Source: Coinglass
The 2-week liquidation heatmap concurred with the 3-month’s finding. It, too, emphasized the importance of the $2.84 zone as a short-term price target.
It was highly likely that SUI prices would test this level before attempting a recovery.
To the north, the liquidation levels were relatively sparse until the $3.37-$3.53 area.
This lack of liquidation levels presented a chance of a quick price bounce from $2.84 to $3.52, but such a move would be dependent on market-wide sentiment.
Disclaimer: The information presented does not constitute financial, investment, trading, or other types of advice and is solely the writer’s opinion


